|
What goes Where? Perceptions of Stages in the Data Modelling Process
In November 2004, I gave seminar / Master Class attendees in London and Los Angeles a questionnaire which asked them to nominate the main stages in database specification (from user need to completed specification). I allowed room for five (a couple squeezed in six). I got 55 responses (25 from London , 30 from LA). I also asked respondents to whether each stage was “data modelling” and who was responsible.
What are the perceived stages?
The table below shows the range of data modelling stages nominated by survey respondents (there has been some consolidation to deal with minor variations in names, and anything that happened after the initial specification – e.g. ‘testing' – was classified as “Post Design Activities”). They are sorted in order of “average stage number” – to give an overall idea of where they appeared in sequence.
| Standard Stage Code Name |
Number of respondents (total 55) who included this stage |
Percentage who classified the stage as data modelling |
Preliminary |
5 |
60.0% |
Business Requirements |
46 |
43.5% |
Process Analysis |
3 |
0.0% |
Conceptual Modelling |
32 |
84.4% |
Architecture Activities |
4 |
75.0% |
Analysis |
2 |
50.0% |
Technical Requirements |
1 |
0.0% |
Data Modelling |
9 |
100.0% |
Logical Data Modelling |
41 |
100.0% |
Design |
2 |
50.0% |
Other |
8 |
62.5% |
Logical & Physical Data Modelling |
3 |
100.0% |
First Cut Physical |
2 |
100.0% |
Physical Data Modelling |
33 |
69.7% |
Validation |
3 |
100.0% |
Physical Database Design |
22 |
40.9% |
Post Design Activities |
27 |
22.2% |
How do the stages fit together?
I classified the responses into a series of patterns shown in the table below. The decimal numbering reflects the fact that detailed analysis of activities (see below) showed that respondents were using the terms “physical data modelling” and “physical database design” either as synonyms or (in only 6 cases) as a way of splitting that stage into two parts.
| Pattern Number |
Count LA |
Count London |
Total |
Stage 1 |
Stage 2 |
Stage 3 |
Stage 4 |
Stage 5 |
1.0 |
6 |
5 |
11 |
Business Requirements |
Conceptual DM |
Logical DM |
Physical DM |
|
1.1 |
2 |
2 |
4 |
Business Requirements |
Conceptual DM |
Logical DM |
Physical DBD |
|
1.2 |
2 |
2 |
4 |
Business Requirements |
Conceptual DM |
Logical DM |
Physical Modelling |
Physical DB Design |
2.0 |
7 |
0 |
7 |
Conceptual DM |
Logical DM |
Physical DM |
|
|
2.1 |
0 |
1 |
1 |
Conceptual DM |
Logical DM |
Physical DBD |
|
|
3.0 |
4 |
2 |
6 |
Business Requirements |
Data Modelling |
Physical DB Design |
|
|
4.0 |
2 |
1 |
3 |
Business Requirements |
Conceptual DM |
Logical/Physical |
|
|
5.0 |
1 |
0 |
1 |
Business Requirements |
Conceptual/ Logical DM |
Physical DM |
|
|
6.0 |
3 |
2 |
5 |
Business Requirements |
Logical DM |
Physical DM |
|
|
6.1 |
1 |
5 |
6 |
Business Requirements |
Logical DM |
Physical DBD |
|
|
6.2 |
0 |
1 |
1 |
Business Requirements |
Logical DM |
Physical DM |
Physical DBD |
|
7 |
0 |
1 |
1 |
Conceptual/ Logical DM |
Physical DM |
|
|
|
Other |
2 |
3 |
5 |
|
|
|
|
|
TOTAL |
30 |
25 |
55 |
|
|
|
|
|
Who is responsible for each stage?
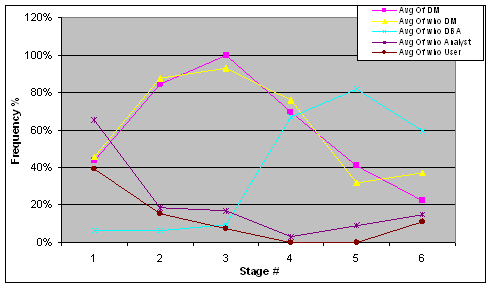
The table and graph below show the most commonly cited job responsibilities for the most commonly-cited stages.
Standard Stage Code Name |
Avg Of Stage No (sequence indicator) |
Data Modeller |
DBA |
Analyst |
User |
Business Requirements |
1.15 |
46% |
7% |
65% |
39% |
Conceptual Modelling |
1.91 |
88% |
6% |
19% |
16% |
Logical Data Modelling |
2.80 |
93% |
10% |
17% |
7% |
Physical Data Modelling |
3.91 |
76% |
67% |
3% |
0% |
Physical Database Design |
4.09 |
32% |
82% |
9% |
0% |
Post Design Activities |
4.52 |
37% |
59% |
15% |
11% |

Who is responsible? The “Avg of DM” line shows the percentage of respondents nominating this stage who answered “yes” to the question “Is it data modelling?”
What activities get done in what stages?
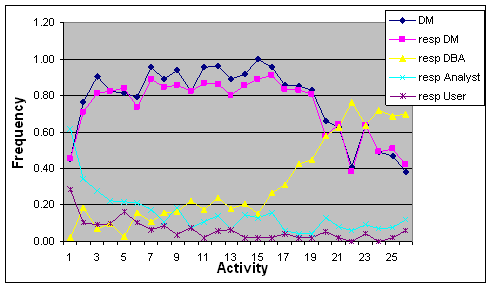
The questionnaire listed 26 ‘activities' and asked respondents to nominate the stage to which they belonged. The table below shows the activities sorted by the stage number to which they were allocated (giving an idea of overall sequence). It also shows the answers to “is it data modelling?” and “who is responsible?” for the stage to which the activity was allocated.
Sequence |
Activity Name |
Is it Data Modelling? |
DM Resp. |
DBA
Resp. |
Analyst Resp. |
User
Resp. |
1 |
Identify business (data) requirements |
45.2% |
45.2% |
2.4% |
61.9% |
28.6% |
2 |
Negotiating compromises with the business stakeholders |
76.3% |
71.1% |
18.4% |
34.2% |
10.5% |
3 |
Identify entities and relationships |
90.7% |
81.4% |
7.0% |
27.9% |
9.3% |
4 |
Documenting rules about data which cannot be represented in the data model |
82.5% |
82.5% |
10.0% |
22.5% |
10.0% |
5 |
Ensuring that business change can be accommodated |
81.1% |
83.8% |
2.7% |
21.6% |
16.2% |
6 |
Ensuring (user) data requirements are met |
78.9% |
73.7% |
15.8% |
21.1% |
10.5% |
7 |
Identify attributes |
95.7% |
89.1% |
10.9% |
17.4% |
6.5% |
8 |
Specifying attribute domains |
88.9% |
84.4% |
15.6% |
11.1% |
8.9% |
9 |
Normalization |
93.9% |
85.7% |
16.3% |
18.4% |
4.1% |
10 |
Integrating different views of the data |
82.5% |
82.5% |
22.5% |
7.5% |
7.5% |
11 |
Specifying primary keys |
95.7% |
87.0% |
17.4% |
10.9% |
2.2% |
12 |
Translating an E-R (or other conceptual) model into a relational model |
96.0% |
86.0% |
24.0% |
14.0% |
6.0% |
13 |
Disaggregating attributes into atomic data |
88.9% |
80.0% |
17.8% |
6.7% |
6.7% |
14 |
Including foreign keys |
91.7% |
85.4% |
20.8% |
14.6% |
2.1% |
15 |
Resolving many-to-many relationships |
100% |
89.1% |
15.2% |
13.0% |
2.2% |
16 |
Removing derivable data |
95.6% |
91.1% |
26.7% |
15.6% |
2.2% |
|
Changing the database to meet new business requirements |
74.0% |
69.0% |
26.0% |
0.0% |
26.0% |
17 |
Specifying the datatype for each column |
85.4% |
83.3% |
31.3% |
6.3% |
4.2% |
18 |
Specifying column names |
85.1% |
83.0% |
42.6% |
4.3% |
2.1% |
19 |
Specifying how subtype hierarchies will be implemented |
83.0% |
80.9% |
44.7% |
4.3% |
2.1% |
|
Advising programmers on understanding the database |
73.0% |
73.0% |
54.0% |
0.0% |
8.0% |
20 |
Specifying views |
65.8% |
57.9% |
57.9% |
13.2% |
5.3% |
21 |
De-normalization for performance |
62.5% |
64.6% |
62.5% |
8.3% |
2.1% |
22 |
Specifying data distribution |
41.2% |
38.2% |
76.5% |
5.9% |
0.0% |
23 |
Adding derivable data to improve performance |
63.6% |
63.6% |
63.6% |
9.1% |
4.5% |
24 |
Specifying database indexes |
48.8% |
48.8% |
72.1% |
7.0% |
0.0% |
25 |
Specifying physical placement of data on storage media |
47.1% |
51.0% |
68.6% |
7.8% |
2.0% |
26 |
Tuning the database for performance |
38.0% |
42.0% |
70.0% |
12.0% |
6.0% |
(Two sequence numbers are missing – these activities were excluded from later analysis (and the graph below) as they did not represent design decisions within the scope of the question.

As always, just an overview of results. A more complete version is on its way (with appropriate academic rigour) to my PhD thesis, and will doubtless also be published in a practitioner-friendly form at some stage.
Summary of Surveys, Interviews and Experiments
What is Data Modelling? (Survey Results) posted 2nd December 2004
Data Modeling - Analysis or Design? (Survey results and comparison with Accountants & Architects) posted 17th December 2004 |

